
Hourly forecasts, beautifully charted.
A clean, fast 16-day forecast for any place on Earth, readable in one sentence and one chart.
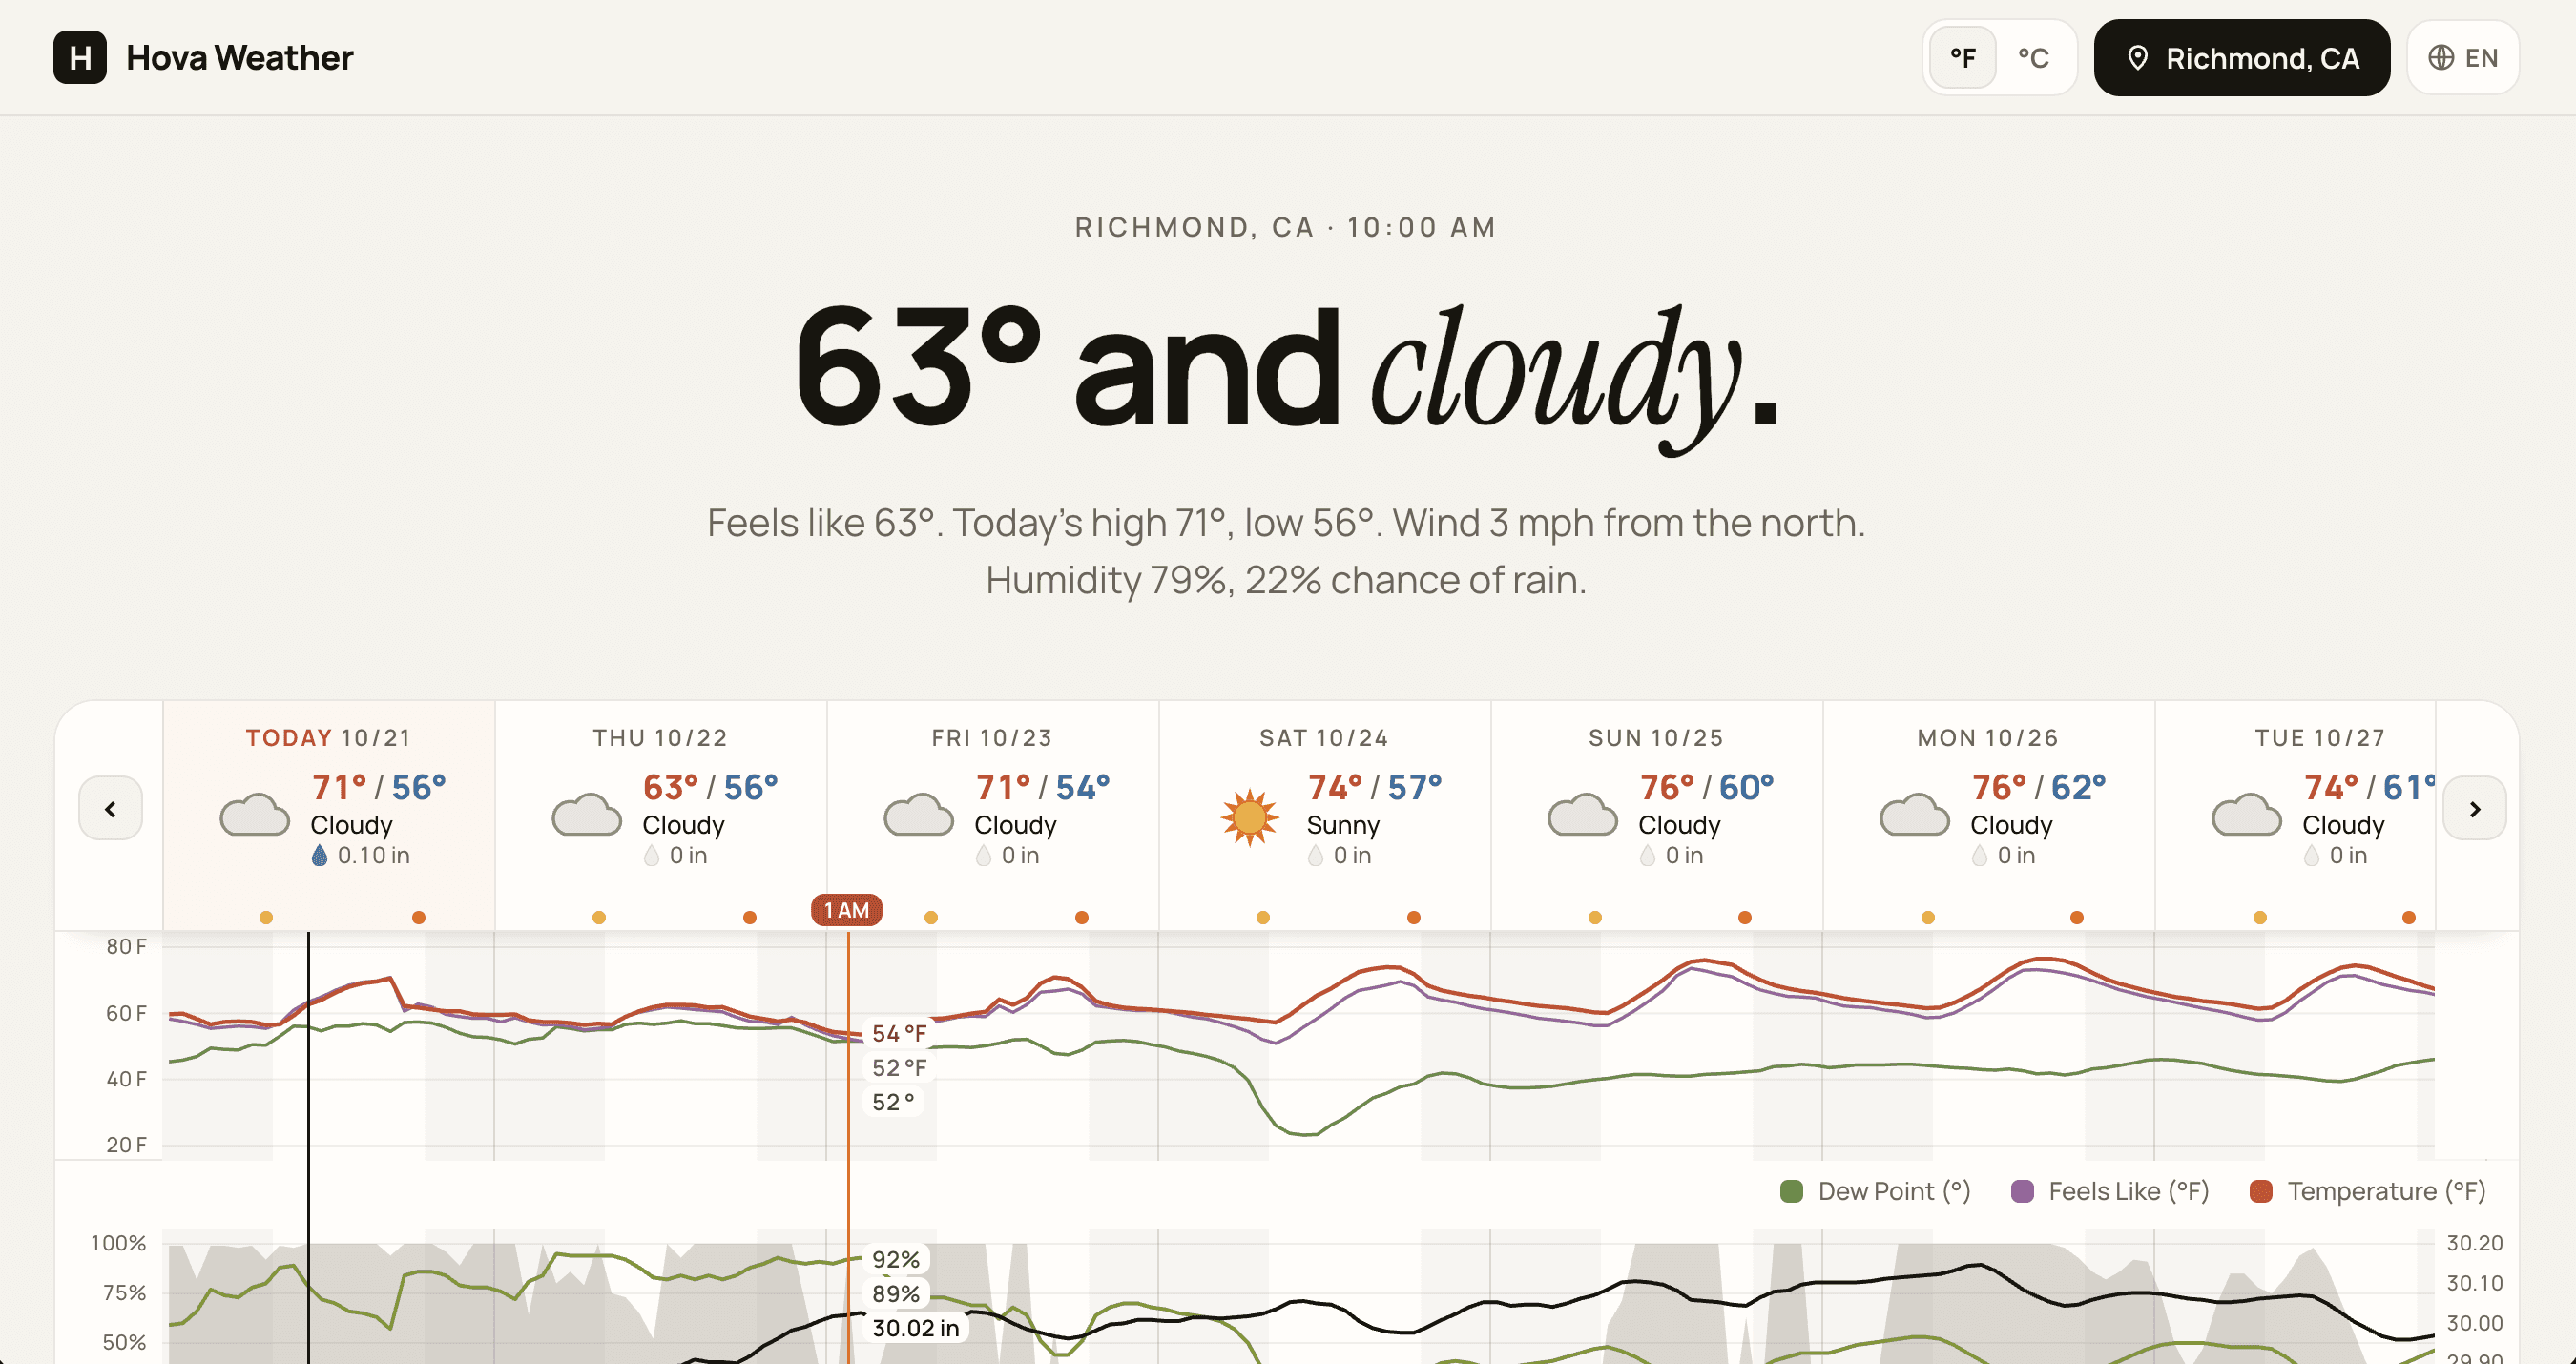
The whole forecast on one page.
Most weather sites bury the hourly data people actually want under ads, widgets, and tabs, and load slowly while doing it. Hova Weather started as an internal question: what would a forecast look like if it loaded instantly, looked like it belonged on this site, and told you the story in one sentence?
The answer is a single scrolling page. A plain-language headline sums up right now. A day strip shows highs, lows, rain, sunrise, and sunset for the next 16 days. Below it, stacked hourly charts cover temperature, feels like, dew point, cloud cover, precipitation, humidity, pressure, and wind. Pick any place by searching or tapping a map, switch between °F and °C, and read it all in 20 languages.
Visit Hova Weather →A forecast you can read in a sentence.
Every forecast opens with a headline you could say out loud: “63° and cloudy.” The lede under it folds feels-like, today’s high and low, wind, humidity, and the chance of rain into two plain sentences. Most visitors have what they came for before they scroll.
The typography is borrowed straight from hovalabs.com: Manrope for the numbers and Instrument Serif italic for the condition, on the same warm paper-and-ink palette, with a dark theme that follows the system. Weather icons are simple single-color glyphs, so the day strip stays calm no matter what the week holds.
63° and cloudy.
Feels like 63°. Today’s high 71°, low 56°. Wind 3 mph from the north. Humidity 79%, 22% chance of rain.
Charts you can drive from the keyboard.
Hover or arrow-key through the hours and one cursor runs through every chart at once, so you read a single moment across temperature, rain, humidity, pressure, and wind without hunting for it. Page Up and Page Down jump a whole day. Day boundaries, night shading, and sunrise and sunset markers keep you oriented 16 days out.
None of it is visual-only. Each day in the strip announces its high, low, and rainfall to screen readers, and every chart has a plain hourly table behind it, so the forecast reads just as well without sight. Choosing a place works the same way: search by name or postal code, or tap the map, and if nothing is named there, the coordinates become the name.
Server-rendered, cached, and quick.
The forecast is rendered on the server with TanStack Start, so the headline, day strip, and charts arrive as HTML before any JavaScript runs; the client then hydrates to add the hour cursor, keyboard navigation, and the location sheet. Every place gets a URL of its own, built from its coordinates, with a canonical link, title, and description, so a forecast can be shared, bookmarked, and indexed like any other page.
Hourly data comes from Open-Meteo and is fetched and cached on the server. If the upstream service stops responding, the page keeps serving the last good forecast with an “updated N minutes ago” note instead of failing, and only shows an error with a retry button when there is nothing cached to fall back on.
Twenty languages, both directions.
The interface ships in 20 languages, from Spanish and Hindi to Swahili and Nigerian Pidgin. Because the headline is a sentence rather than a widget, every language gets its own template, so “63° and cloudy.” reads naturally whether the condition comes before or after the number. Plural rules, compass words, and search results all follow the same message catalog.
Arabic and Urdu flip the whole page right-to-left, day strip and chart navigation included. Times are shown in the forecast location’s time zone, and units switch between Fahrenheit, miles per hour, and inches and Celsius, kilometers per hour, and millimeters with one tap.
Let’s build something big.
Tell us about your engineering goals. We’ll tell you how we’d get there.
Get in touch